
An EV charging curve is the shape of charging speed across a session: the car starts fast, holds a high rate for a while, then steps down as the battery fills. Because the rate changes, the peak power in an advert is reached only briefly. What decides how long a charge actually takes is the average rate from the moment you plug in to the moment you leave — not the peak printed on the box.
Key Takeaways
- A charging curve starts high and steps down as the battery fills; the peak is reached only briefly.
- Session time is set by the average rate, so compare 10–80% times rather than peak kW.
- Cold batteries sit on a lower curve; preconditioning lifts it before a fast charge.
- At home power levels the rate is nearly flat, so home charging time is simple division.
The Shape of the Curve, in Plain Terms
A battery accepts energy fastest when it is emptier. As the charge level climbs, the car reduces the rate to protect the cells, so the line slopes down in steps — gently at first, then steeply near the top. That final slope is why charging slows down after 80%. Temperature moves the whole curve: a cold battery’s line sits lower from the first minute, which is why battery preconditioning before a fast charge makes such a difference.
Peak vs Average: One Illustrative Session
The figures below illustrate the shape only — they are not any model’s specification:
| Part of the session | Illustrative rate | What it means |
|---|---|---|
| 10–30% charged | Near the advertised peak | The only window where the peak figure is real |
| 30–60% | Roughly two-thirds of peak | The rate steps down as the battery fills |
| 60–80% | Roughly half of peak | Still useful progress on a trip |
| Above 80% | A fraction of peak | The slow tail — usually where drivers stop |
Add the windows together and a car that peaks at, say, 150 kW in this illustration averages far less across a 10–80% session. The honest comparison between two cars is the time for the same window, not the peak.
How to Judge a Car or Charger by Its Curve
- Compare 10–80% times, not peak kW. A car with a lower peak but a flatter curve can finish the window sooner than a high-peak car that fades early.
- Match the charger to the curve. A station can only offer power; the car draws what its curve allows. The U.S. DOT class ranges — Level 2 adding 10–20 miles of range per hour, DC fast charging 180–240 — are session averages, not peaks (DOT, Charger Types and Speeds).
- Arrive lower, leave at 80%. On a trip, the fast part of the curve is at the bottom. Two shorter stops usually beat one long one — see How Fast Is a DC Fast Charger?
- Allow for sharing. Some stations split power between two cars, which lowers each car’s whole curve while both are plugged in.
Why the Curve Barely Matters at Home
Home charging runs at far lower power than a DC session. At Level 2 rates the car sits well below the point where its curve steps down, so it charges at a nearly steady rate until the battery is almost full. That is why home charging time really is just energy divided by power, as the worked examples for charging at 7 kW, 11 kW and 22 kW show.
Home Chargers Built for a Steady Rate
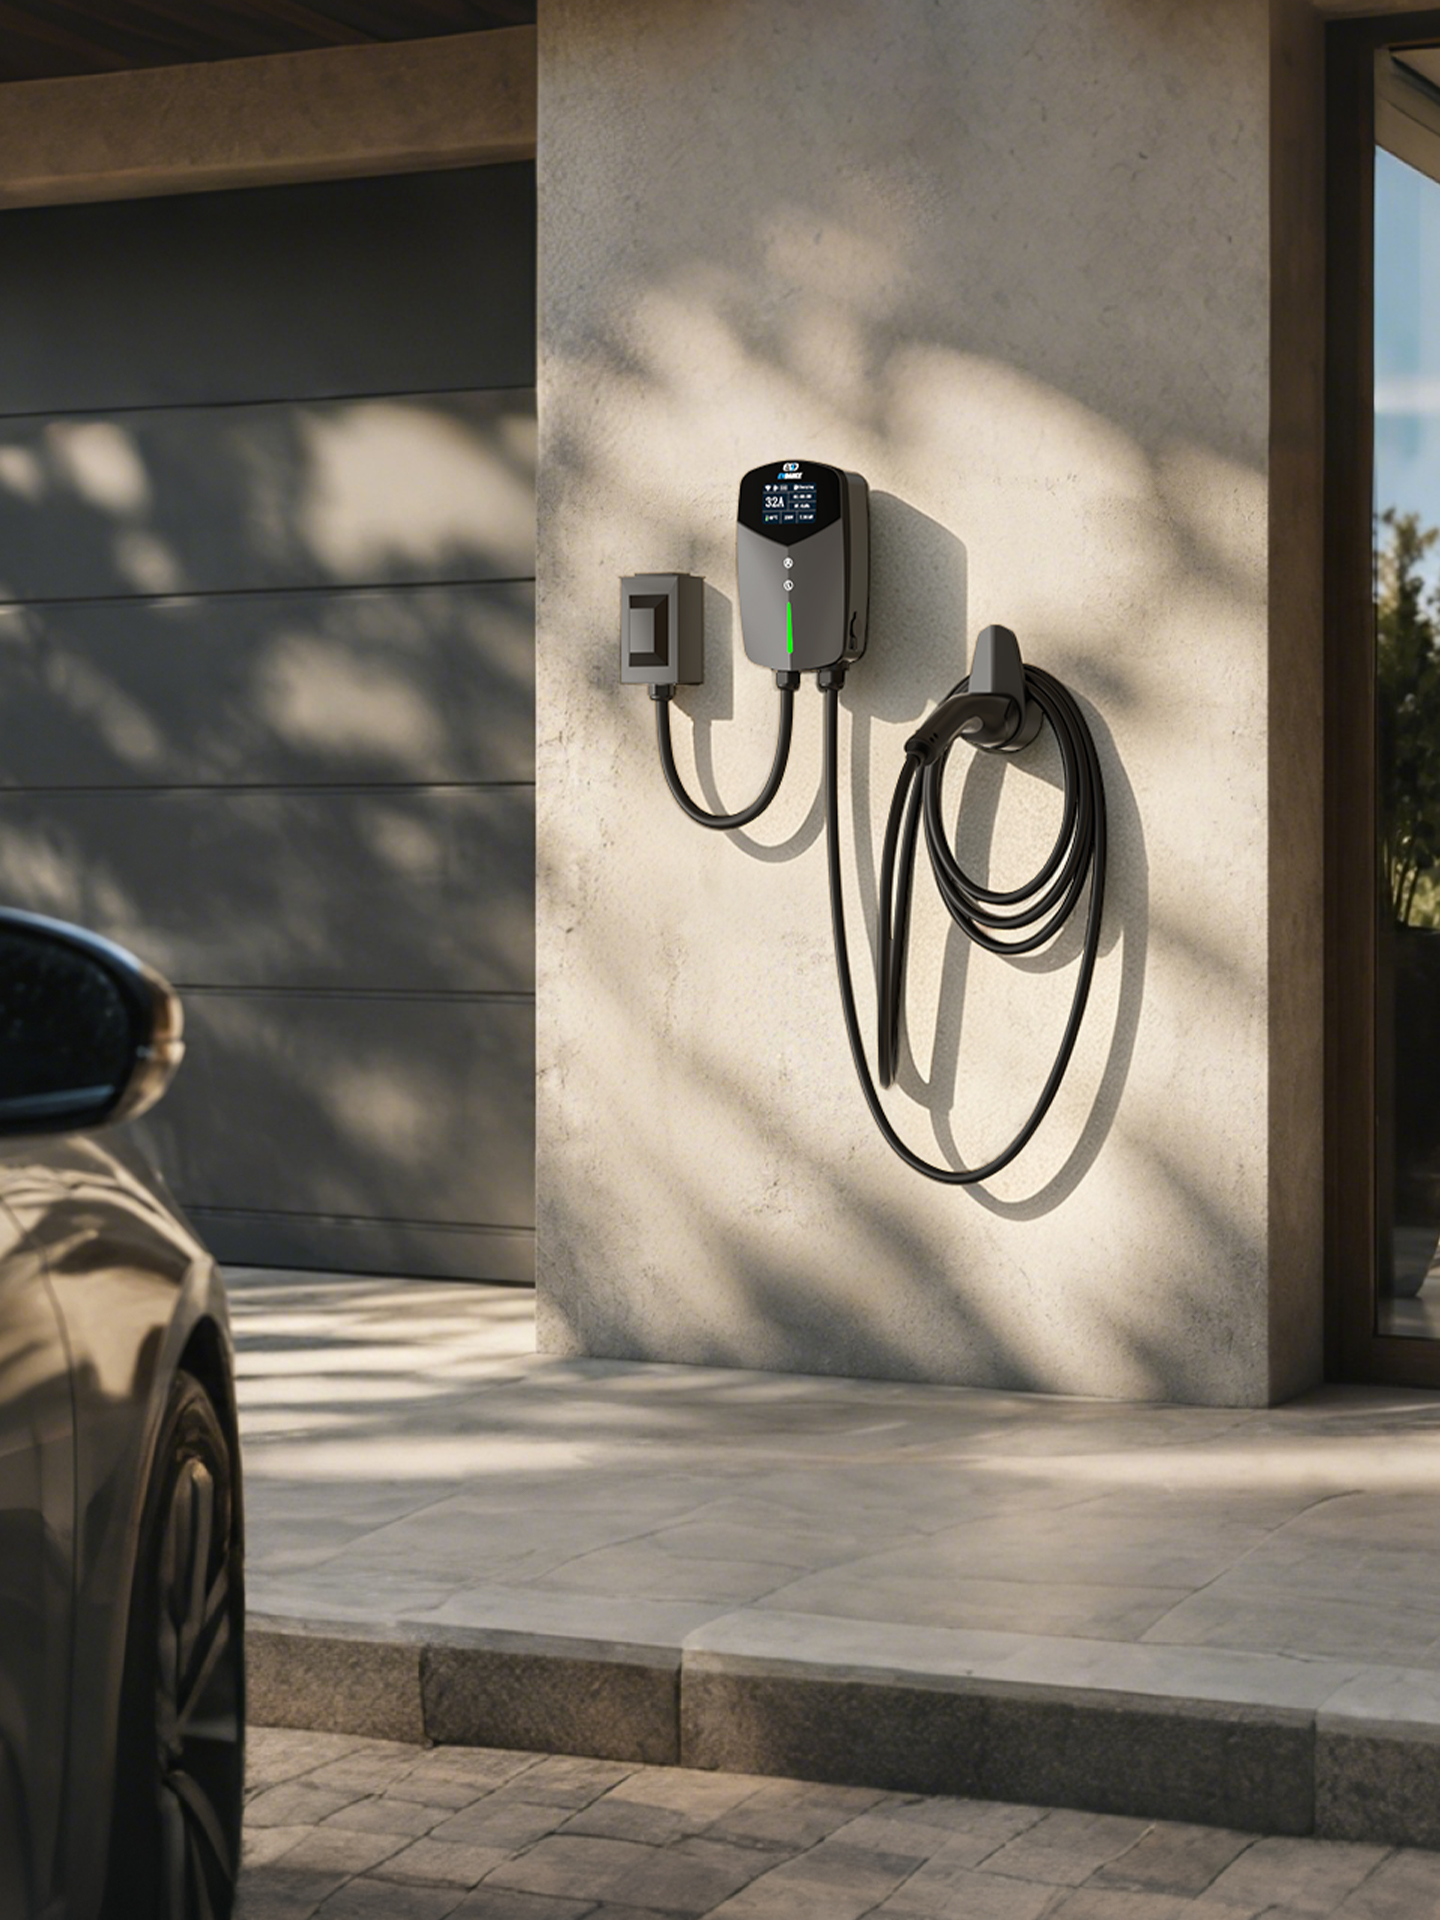
A wall charger’s rating is the rate it can offer all session long; the car decides what it takes. The EVDANCE EV-ACT5006T is a 48 A Level 2 wall charger (hard-wired or NEMA 14-50P, NACS, 25 ft cable, IP65/IP66, ETL/FCC/CE), and the EV-ACS4005T is a 40 A portable charger (9.6 kW, NEMA 14-50P, adjustable at 16/24/32/40 A, IP66). Either delivers its rate hour after hour — the flat part of home charging where curves do not bite.
Frequently Asked Questions
Why did my car never reach the charger’s advertised kW?
The peak needs three things at once: a low battery, a warm pack, and a car whose maximum matches the station. Most of a session is spent below the peak by design, so a lower number on the display is normal.
Is a car with a higher peak always faster on a road trip?
Not necessarily. Compare the published 10–80% times. A flatter curve at a lower peak can beat a spiky curve over the window drivers actually use.
Does the charging curve affect battery life?
The curve exists to protect the battery — the car slows itself rather than forcing in energy at a rate the cells cannot accept. It needs no action from you.
Related Reading
- Why Does EV Charging Slow Down After 80%?
- How Long Does It Take to Charge an EV at 7 kW, 11 kW and 22 kW?
- How Fast Is a DC Fast Charger?
- What Is a Rapid EV Charger? Slow, Fast, Rapid and Ultra-Rapid Explained