
No single EV has the best charging curve, and the peak kW figure in the advert cannot tell you which car charges fastest in real use. A charging curve — how charging speed changes as the battery fills — is best compared by the time a car needs for the same window, usually 10 to 80 percent, and by its average power across that window. A lower-peak car with a flat curve often finishes first.
Key Takeaways
- There is no universal winner — and peak kW is the weakest evidence.
- Compare 10–80% times and average power over that window.
- A flat curve can beat a high peak; efficiency turns kilowatts into miles.
- If you mostly charge at home, the curve barely matters — buy for your trips.
The Three Numbers That Describe a Curve
Every curve can be summed up with three figures. Only one of them is printed in large type.
| Number | What it tells you | How much to trust it |
|---|---|---|
| Peak kW | The highest rate, reached briefly, usually at low charge | A best case, not a session rate |
| 10–80% time | Minutes for the window drivers actually use on trips | The practical comparison figure |
| Average kW over 10–80% | Energy added divided by time — flat vs peaky, in one number | The curve’s honest summary |
The reason the rate falls at all is battery protection: as the pack fills, the car steps the power down, which is why charging slows after 80 percent. Two cars with the same peak can have completely different steps.
Flat vs Peaky: An Illustrative Comparison
The shapes below are illustrations, not any model’s specification. Imagine two cars at the same fast charger:
| Car A — high peak | Car B — flat curve | |
|---|---|---|
| Advertised peak | Higher | Lower |
| Rate at 50% charge | Already well below peak | Still close to its peak |
| Rate at 75% charge | A fraction of peak | Stepped down once |
| 10–80% session | Fast start, long tail | Steadier — can finish sooner overall |
One more multiplier matters: efficiency. A curve delivers kilowatts; the car turns them into miles. A car that travels further per kWh gains more range per minute on the same curve. So compare range added in the 10–80% window — the U.S. DOT puts DC fast charging overall at roughly 180 to 240 miles of range per hour — rather than kilowatts alone. Session-level context is in how fast is a DC fast charger.
How to Compare Curves Before You Buy
- Start with the manufacturer’s 10–80% time, not the peak. If only a peak is quoted, treat the comparison as incomplete.
- Work out the average. If a maker states the energy or the time for a window, divide one by the other. Averages expose peaky curves at once.
- Look at measured curves in independent tests. Read where the rate steps down: a car holding its rate past 50% behaves very differently on a trip from one that fades at 30%.
- Check the rate at the level you will actually use. On a test drive, plug into a fast charger at a mid-level battery and read the car’s own charge screen — how DC fast chargers work explains what the car and station each control.
- Ask about preconditioning. A cold battery charges slowly whatever the curve promises; cars that warm the pack on the way to a charger protect the whole curve, as EV battery preconditioning explains.
Match the Curve to Your Driving
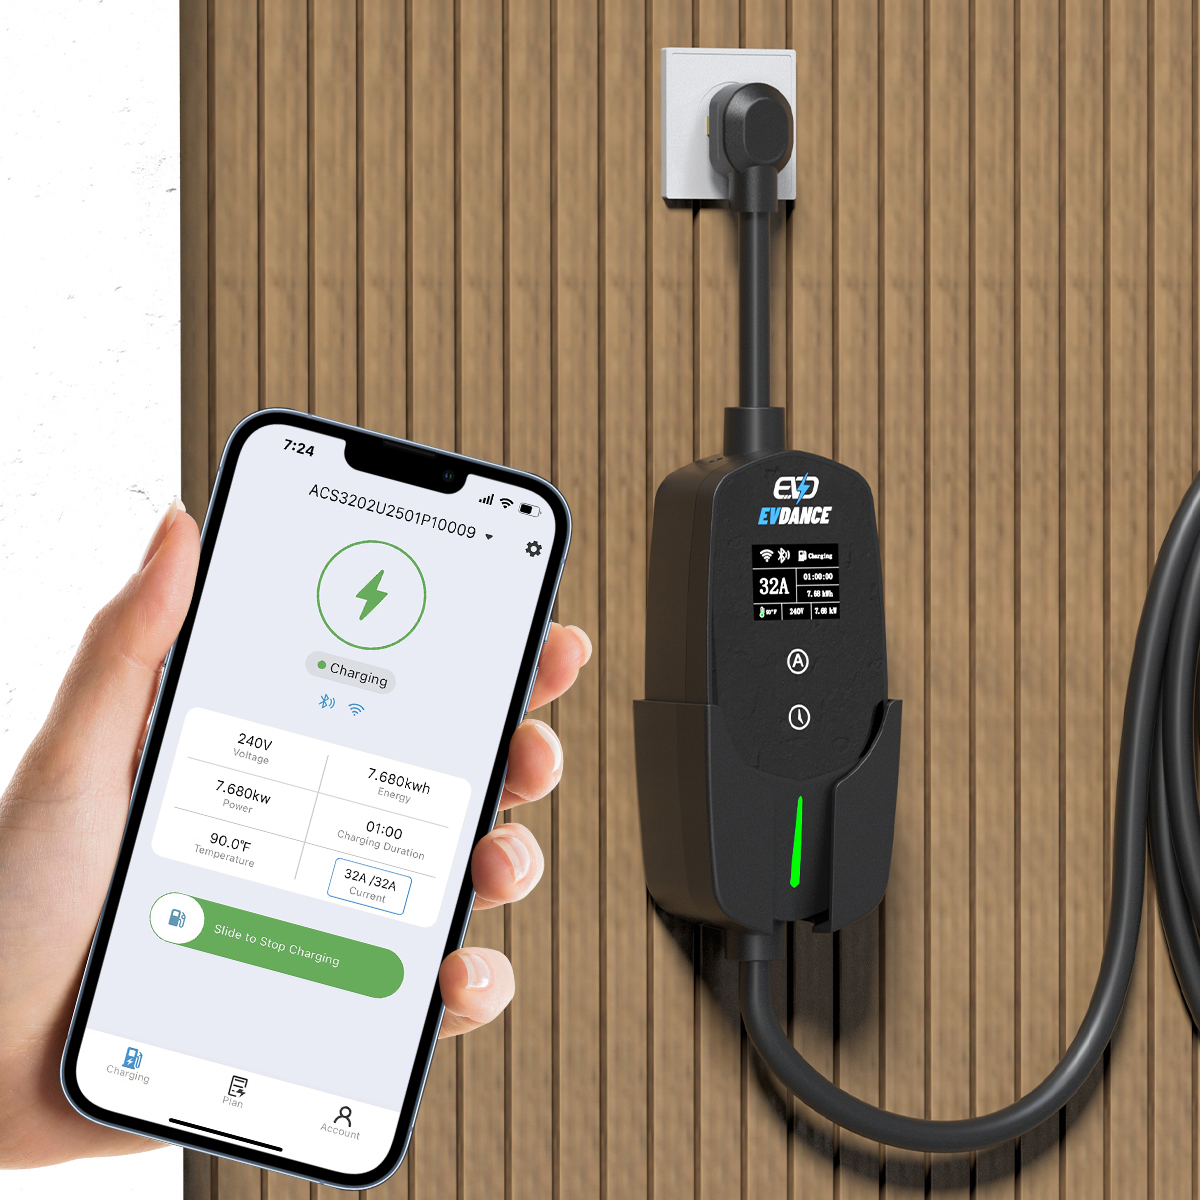
If you charge at home and fast-charge twice a year, the curve is a minor spec — everything refills overnight on Level 2, at rates far below where curves bend. If you road-trip monthly, a flat curve and a short 10–80% time are worth real money and minutes. At home, what matters is simply a charger that refills you by morning: the EV-ACT5006T 48A Level 2 wall charger (up to 48 A, 25 ft cable, IP65/IP66) for a permanent setup, or the EV-ACS4005T 40A NACS portable charger (9.6 kW, NEMA 14-50P) for a 240 V outlet.
Frequently Asked Questions
Is a higher peak kW always better?
No. Peak is a moment, not a session. A car that peaks lower but holds its rate longer can add more energy — and more range — in the same 10 to 80 percent window.
Why do makers advertise peak power?
Because it is the biggest number the car can honestly claim, and it is easy to print. It describes the first minutes of a near-empty, warm battery — conditions you will not always have.
Does my home charger change the car’s curve?
No. The car controls how much power it accepts. Home AC charging runs at 7 to 19 kW on Level 2 — below the point where the DC curve bends — so home charging speed is set by the charger and circuit, not the curve.
Related Reading
- How Fast Is a DC Fast Charger?
- Why Does EV Charging Slow Down After 80%?
- How Do DC Fast Chargers Work?
- What Is EV Battery Preconditioning?