
A charging session lasts as long as the energy you add divided by the rate you add it at — so when sessions keep getting longer, one of those two numbers has moved. Over a few weeks it is usually the energy: you are putting more in than you used to. Two old session records tell you which.
Key Takeaways
- Session time is energy divided by rate — a lengthening session means one of the two moved.
- Compare two finished sessions a month apart: kilowatt-hours, hours, average rate, start and end percentage.
- More energy is the usual story: more driving, cold weather, a target that crept up, or another car on the charger.
- Gradual change is conditions or ageing; a sudden change is a fault to diagnose.
The Only Two Ways a Session Gets Longer
The arithmetic is plain. Session time is roughly the kilowatt-hours added divided by the average charging rate in kilowatts. A labelled example: adding 30 kWh at about 7.7 kW takes about 3.9 hours; add 36 kWh at the same rate and the night stretches to about 4.7 hours — same car, same charger, nothing wrong. Level 2 charging spans 7 to 19 kW in the U.S. Department of Transportation’s figures, but your own setup’s rate does not normally wander week to week. The energy figure moves all the time.
Compare Two Sessions a Month Apart
Pick two finished sessions on the same charger, ideally with a similar starting percentage, and lay them side by side.
| Compare | Where you find it | What it tells you |
|---|---|---|
| Kilowatt-hours added | Session record in the charger app, car or receipt | If this rose, the session had more work to do |
| Hours actually charging | Session duration — not time plugged in after finishing | The figure the energy was spread over |
| Average rate (kWh ÷ hours) | Your own division of the two numbers above | If this fell while energy stayed flat, the rate side changed |
| Start and end percentage | Car or app history | A lower start or higher target stretches any session |
If You Are Adding More Energy Than Before
This is the common case:
- You are driving more. A longer commute or a new school run — more miles out means more kilowatt-hours back in.
- The season turned. In cold weather the car uses more energy per mile, and some incoming power warms the battery instead of storing charge — the job battery preconditioning exists to do.
- Your target crept up. A higher limit adds the slowest part of the battery every session, because charging slows down after 80%.
- Someone else used the charger. A second car’s sessions in the same records inflate “your” times.
If the Energy Is the Same but the Rate Fell
Then the comparison has pointed at the rate side — which has its own checklist, covered in depth in why an electric car charges slowly at home: current settings, heat, voltage and shared circuits. One cause is new in many homes: load management trimming the charger while the house is busy — load balancing explains what that does to your rate.
Drift or Drop? Reading the Timeline
The shape of the change is the last clue. Lengthening that arrives gradually with the season is conditions, not decline. Softening that builds over years — most visibly a lower peak at DC fast chargers — is normal ageing, part of how an EV battery degrades over time. A change that lands between one week and the next is neither: treat a sudden drop as a fault and have it diagnosed.
Records Make This a Five-Minute Job
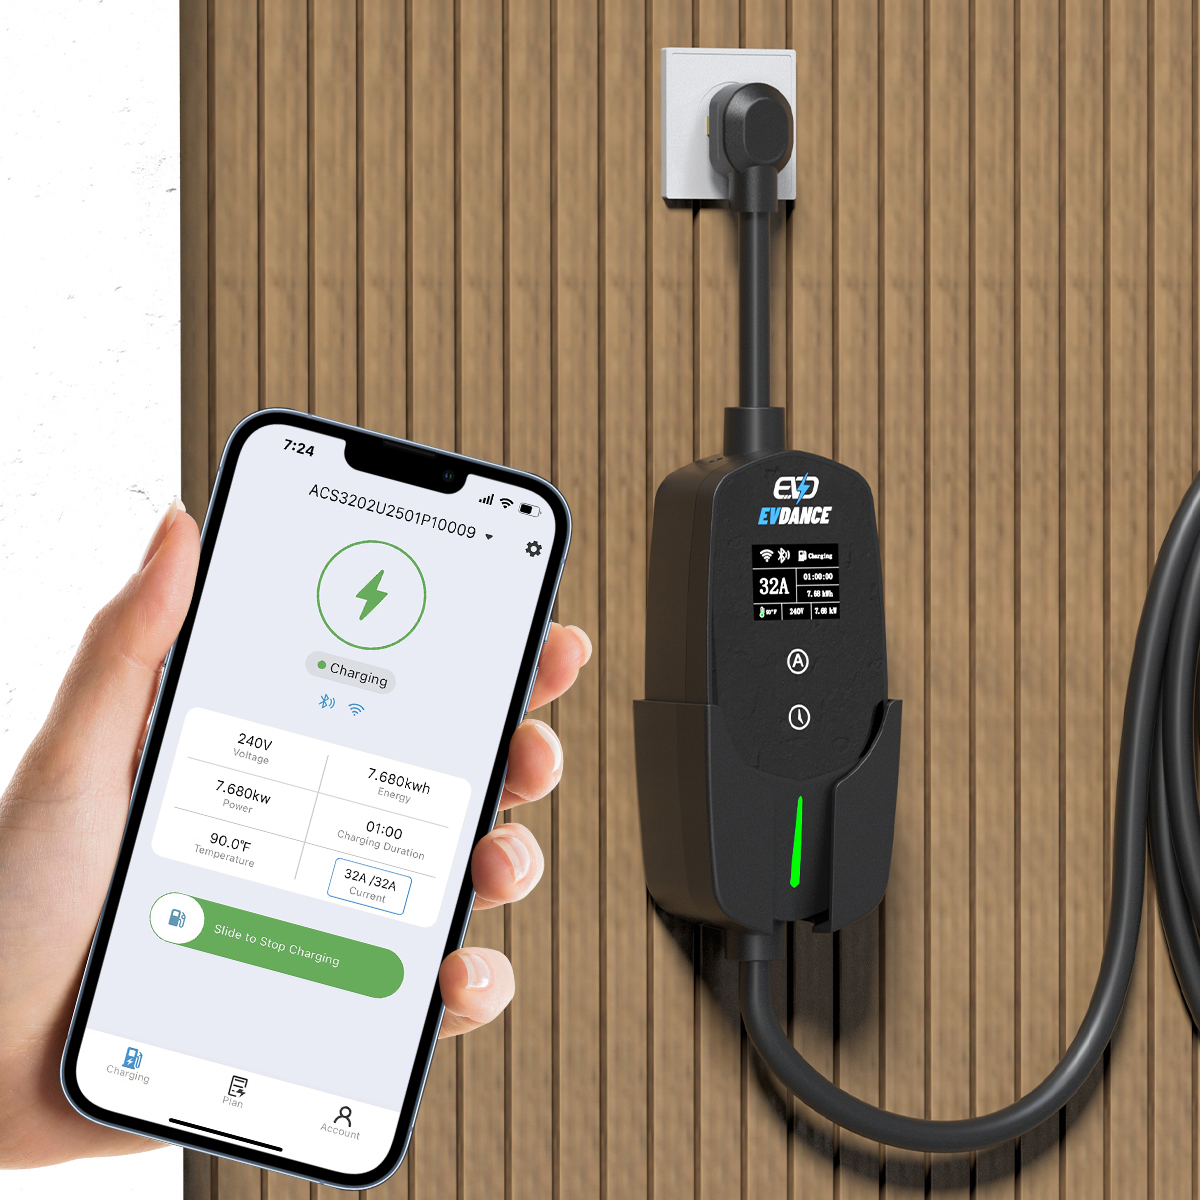
The comparison needs history, which is where an app-connected charger earns its keep. The EV-ACT3204PE 22 kW wallbox offers RFID and app control, so session energy and duration are there to compare. For a high-output home unit, the EV-ACT5006T 48A Level 2 wall charger delivers up to 48 A, and the car’s own records do the rest.
Frequently Asked Questions
The finishing time on the dashboard keeps changing. Is that the same problem?
No. The on-screen estimate is a live forecast that moves whenever the rate moves during a session. Judge the trend from finished sessions instead — the energy added and the hours taken are fixed once the session ends, and those are the numbers that can honestly be compared.
Does a longer session mean my battery is wearing out?
Not by itself. Check the kilowatt-hours first: if they rose, the battery took more because the car used more. Wear shows up over years, mostly at DC fast chargers — not as a few extra minutes at home over a month.
Should I time a session with a stopwatch to check?
There is no need — the session’s kilowatt-hours and duration are already recorded. Divide one by the other for the average rate, and compare with a month ago.
Related Reading
- Why Is My Electric Car Charging Slowly at Home?
- Why Does EV Charging Slow Down After 80%?
- What Is EV Battery Preconditioning?
- Does Load Balancing Increase EV Charging Speed?