
The number on the charger is a ceiling — the most it can offer a car able to take it — and every session runs at the lowest limit in the chain: the charger, its setting, the circuit, the cable, or the car’s onboard charger. Before hunting for the limiting link, measure your real rate: the energy delivered divided by the hours actually charging. That one number turns a vague “slow” into evidence you can compare against each stated limit.
Key Takeaways
- The rating is a ceiling, not a promise; every session runs at the lowest limit in the chain.
- Your real rate is energy delivered divided by hours actually charging — measure it before diagnosing.
- Compare the measurement with the car’s rating, the charger’s setting and the circuit’s design to find the limit by evidence.
- The session’s shape — taper, a fixed cap, site sharing, heat — tells you which ceiling you found.
The One Calculation That Tells the Truth
Divide the energy the session delivered, in kilowatt-hours, by the time the car was actually charging, in hours. The result is your average rate in kilowatts — the figure that decides when the car is ready. The kilowatt number on a display is an instantaneous reading, usually highest near the start; comparing that snapshot with the rating on the box is how a healthy session gets misread as slow.
One worked example, invented for illustration: a session delivering 27 kWh over 4.5 hours of charging averaged 6 kW — even if the display showed 7.4 kW at plug-in. Take the energy from the car’s session summary, the charger’s recorded session where it keeps one, or the app record — and count charging time, not plugged-in time. A scheduled wait before the start inflates the denominator and manufactures a problem that is not there.
Compare the Measurement Against Each Ceiling
| The ceiling | Where its number lives | What a match tells you |
|---|---|---|
| The car’s onboard AC rating | The car’s manual and specification | A rate near that figure on every charger means the car is the limit — nothing is faulty |
| The charger’s current setting | The charger’s setting or app | A rate capped at a round, lower figure from minute one is a setting, not a fault |
| The circuit’s design | The installer’s record | Home-only slowness at the design current means the circuit was sized that way |
| The battery’s state | The shape of the session itself | A rate that starts high and steps down is the car’s taper as the battery fills |
The U.S. DOT frames the bands your measurement sits inside: Level 2 runs at 7–19 kW, Level 1 at about 1 kW. A measured average far outside your equipment’s band is worth a second look; one inside it, below a headline rating, is usually the chain working as designed. How many kW a Level 2 charger is explains those bands.
What the Shape of the Session Adds
- Full rate at the start, stepping down later. The car’s taper. Why charging slows after 80% explains the shape; your average simply includes it.
- A lower rate from the first minute, every session. A fixed ceiling: the setting, the circuit design or the car’s onboard limit.
- A rate that changes when other cars plug in. A shared site dividing its power. How load balancing affects charging speed covers that behaviour.
- A rate that sags on hot afternoons only. Heat management somewhere in the chain — worth noting with the pattern, and a different question from the rating.
Chargers That State Their Ceiling Clearly
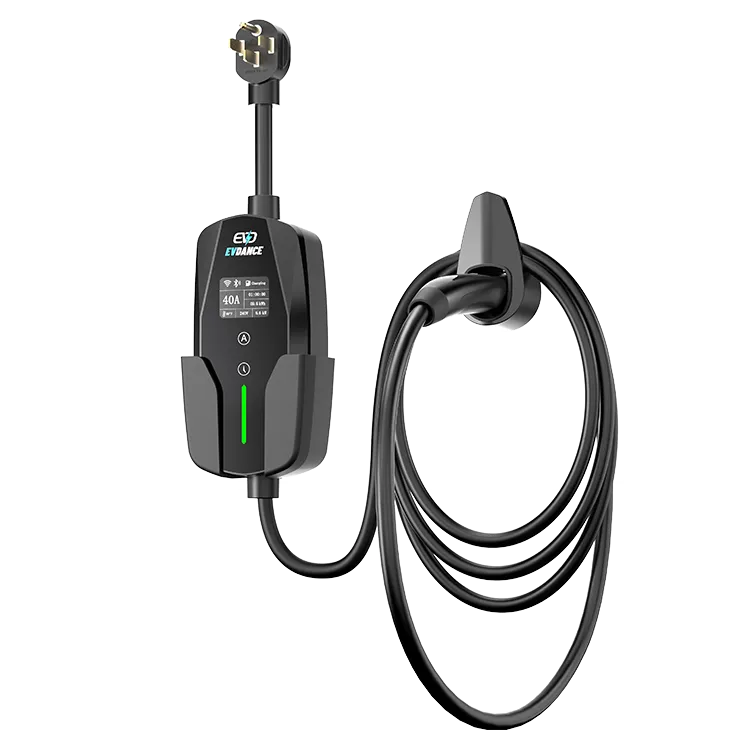
A stated setting is a ceiling you can measure against. The EV-ACS4005T portable charger offers 16/24/32/40 A settings at up to 9.6 kW on a NEMA 14-50 plug — if your measured average sits at a lower step, the setting is the first place to look. The EV-ACT5006T wall charger delivers up to 48 A hard-wired or on a NEMA 14-50 plug; on a circuit designed for it, that is the ceiling its sessions should approach with a car able to take it. Both pages state the ceiling plainly — which is what makes the measurement test possible.
Frequently Asked Questions
The display showed the full rate at the start. Why is my average lower?
Because the average includes everything the snapshot leaves out: the taper as the battery fills, any pauses, and any step-downs. A session is bought in kilowatt-hours delivered, not in its best minute.
Is it worth buying a higher-rated charger?
Only if your measurement shows the charger is the limiting link. If the car’s onboard ceiling or the circuit design sits lower, a bigger charger changes the number on the box and nothing else.
Does the same method work at public chargers?
Yes. The session receipt or the network’s app states the energy delivered; divide by the charging time and compare with your car’s stated maximums before blaming the post — shared sites divide power by design.
Related Reading
- Why Does EV Charging Slow Down After 80%?
- How Many kW Is a Level 2 Charger?
- Does Load Balancing Increase EV Charging Speed?
- Level 1 vs Level 2 vs DC Fast Charging: A Practical Comparison