
Yes, and it is normal. The two devices measure different things at different points. Your charger and its app count the energy that leaves the charger towards the car; the car counts what actually lands in its battery, or shows it as a percentage gained. The gap between the two is mostly charging losses and the car’s own energy use during the session.
Key Takeaways
- The charger counts energy delivered; the car counts energy stored. A gap between them is expected.
- Conversion losses, battery temperature management and the car’s own systems use the difference.
- Percentages, reserves and rounding make small sessions look more mismatched than they are.
- Use the charger figure for cost, the car figure for driving, and flag a suddenly growing gap.
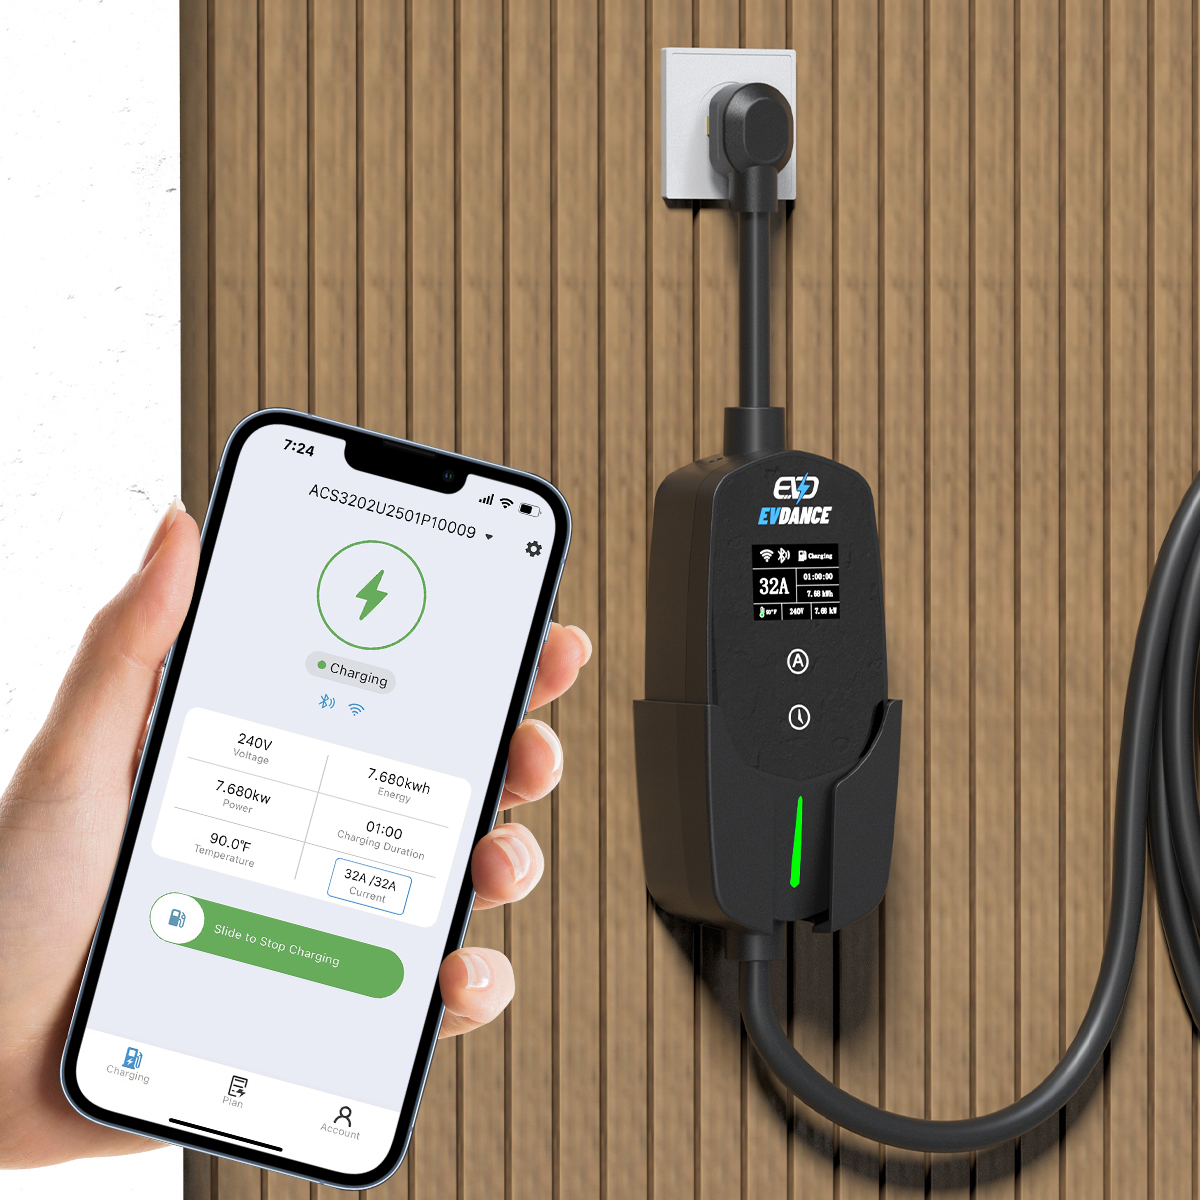
Two Meters, Two Places
| Charger / app figure | Car figure | |
|---|---|---|
| What it counts | Energy supplied by the charger during the session | Energy stored in the battery, or charge percentage gained |
| Measured where | At the wallbox or portable charger | Inside the car’s battery system |
| Includes conversion losses? | Yes, they are part of what it delivered | No, it only sees what arrived |
| Best used for | What a session cost you | How much driving you gained |
Home charging uses AC power, and the car converts it to DC to store in the battery. That conversion, done by the car’s onboard charger, wastes some energy as heat. Our guide to how many kWh it takes to charge an EV uses roughly 10% as a rule of thumb for AC charging losses, so an app figure a tenth higher than the car’s is unremarkable. The wallbox features guide explains which displays and meters chargers offer.
Where the Missing Energy Goes
- Conversion heat: the AC-to-DC conversion in the car is never perfectly efficient.
- Battery temperature management: heating or cooling the pack during the session draws power that warms the battery rather than filling it.
- The car’s other systems: pumps, fans, the 12 V system and cabin heating or cooling while plugged in all sip from the same supply.
- Standby and start-up: a session counted from the moment you plug in can include small draws before charging properly begins.
Percentages Add Another Wrinkle
If the car shows a percentage gained rather than kWh, you are converting between two different units. A percentage is a share of usable capacity, and cars keep a reserve at the top and bottom of the pack, so 0 to 100% on the display is not the battery’s full physical capacity. Rounding plays a part too: displays often round kWh to whole numbers and percentages to whole points, which can make a small session look more different than it is. Finally, the two counters may not start and stop at the same second, especially if the app session opens when you plug in and the car starts counting when power flows.
Which Number Should You Use?
Use the wall-side number for money: it is what left your home’s supply, and what it costs to charge at home is based on energy drawn, not energy stored. Use the car’s number for driving: stored energy and percentage are what turn into miles. For tracking battery health over time, either figure works, provided you use the same one each time; checking EV battery health describes that method. Treat a gap that suddenly grows much larger than your usual pattern, or a charger that reports energy when nothing is plugged in, as a fault to raise with the manufacturer.
Chargers that report their own session data make the comparison easy. The EVDANCE EV-ACT3204PE 22 kW wallbox provides app control and session information, and the EVDANCE EV-ACS4005T portable charger displays energy delivered on the unit itself.
Frequently Asked Questions
Is my charger over-reporting to make sessions look bigger?
No. It is reporting honestly what it supplied. The car stores less than the charger supplies because conversion and the car’s own systems use some energy on the way in.
Why does the car show fewer kWh added than the app?
Because the app counts energy at the charger and the car counts energy in the battery. Losses in conversion, battery heating or cooling, and small system loads sit between the two readings.
Which figure should I use to work out my charging cost?
The charger’s figure. Your electricity bill is based on energy drawn from the supply, including the losses, not just the energy that reached the battery.
Related Reading
- How Many kWh Does It Take to Charge an EV?
- How Much Does It Cost to Charge an Electric Car at Home?
- How to Check EV Battery Health
- Wallbox Home Charger Features Explained: Display, Scheduling, and Load Management